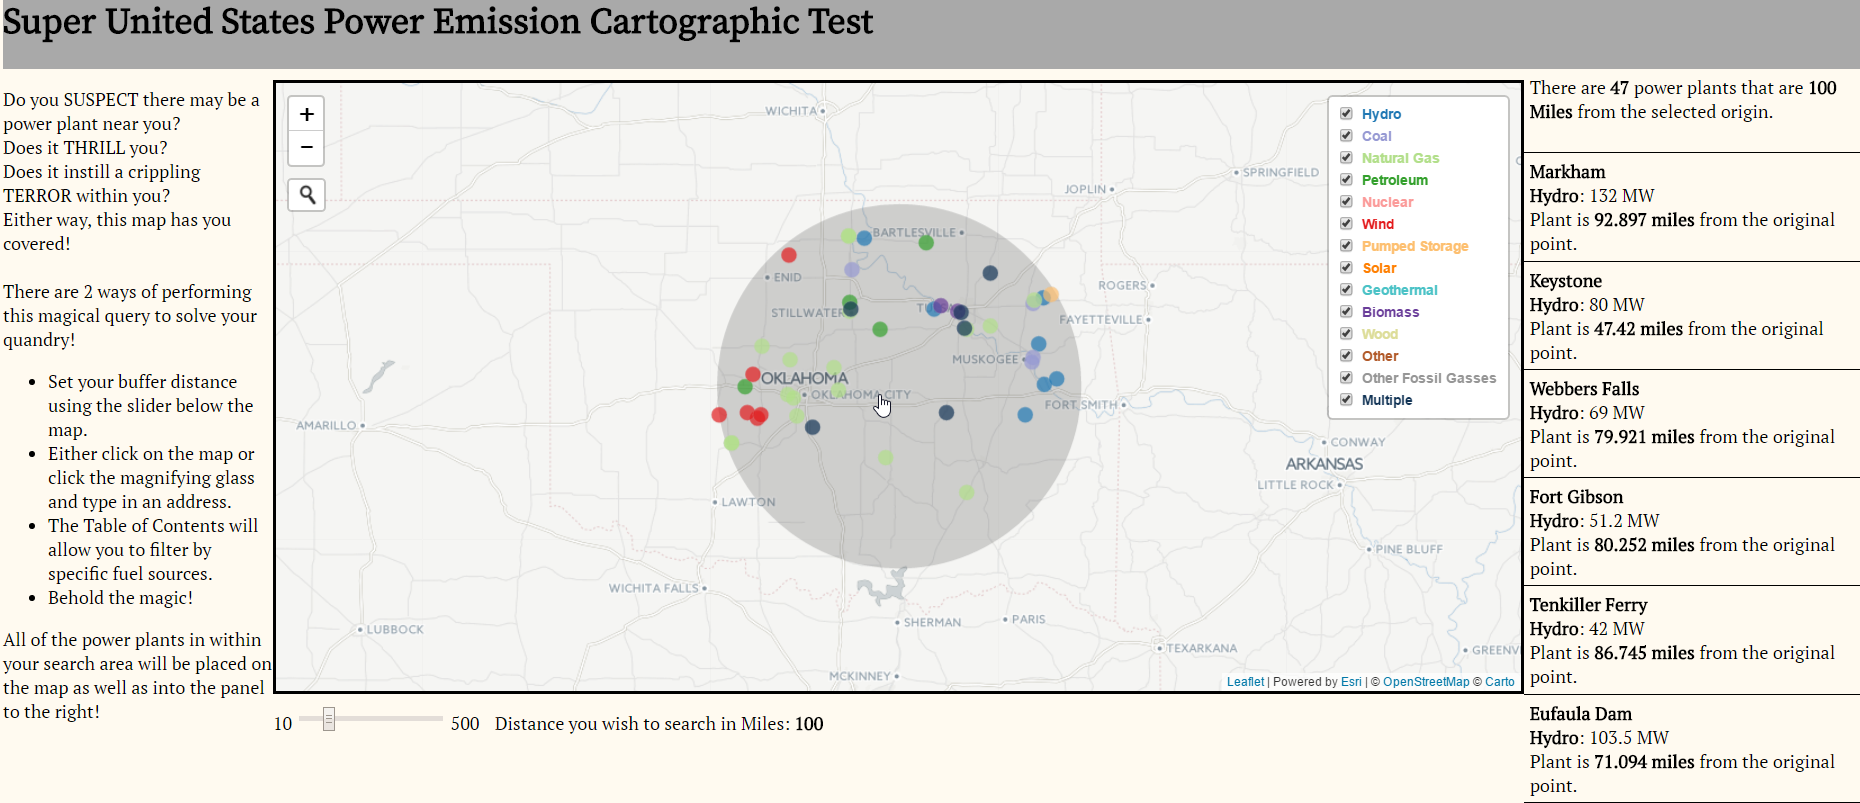
[SUSPECT]Super United States Power Emission Cartographic Test
This map was built with custom JavaScript code drawing upon the Leaflet JavaScript Library
- See the map: US Power Plant Proportional Symbol Map
- Data Source: Energy Information Agency

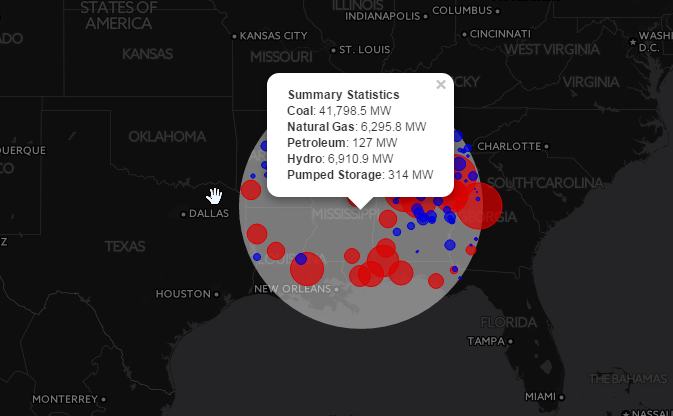
This map was built with custom JavaScript code drawing upon the Leaflet JavaScript Library

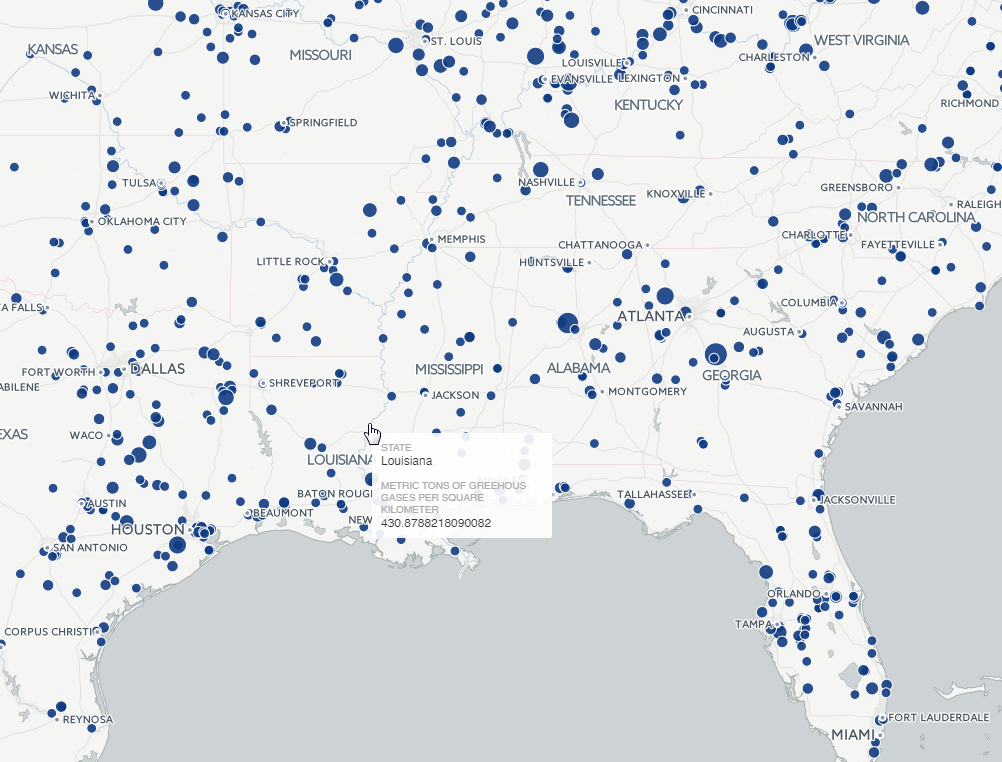
This map was built with custom JavaScript code drawing upon the Leaflet JavaScript Library

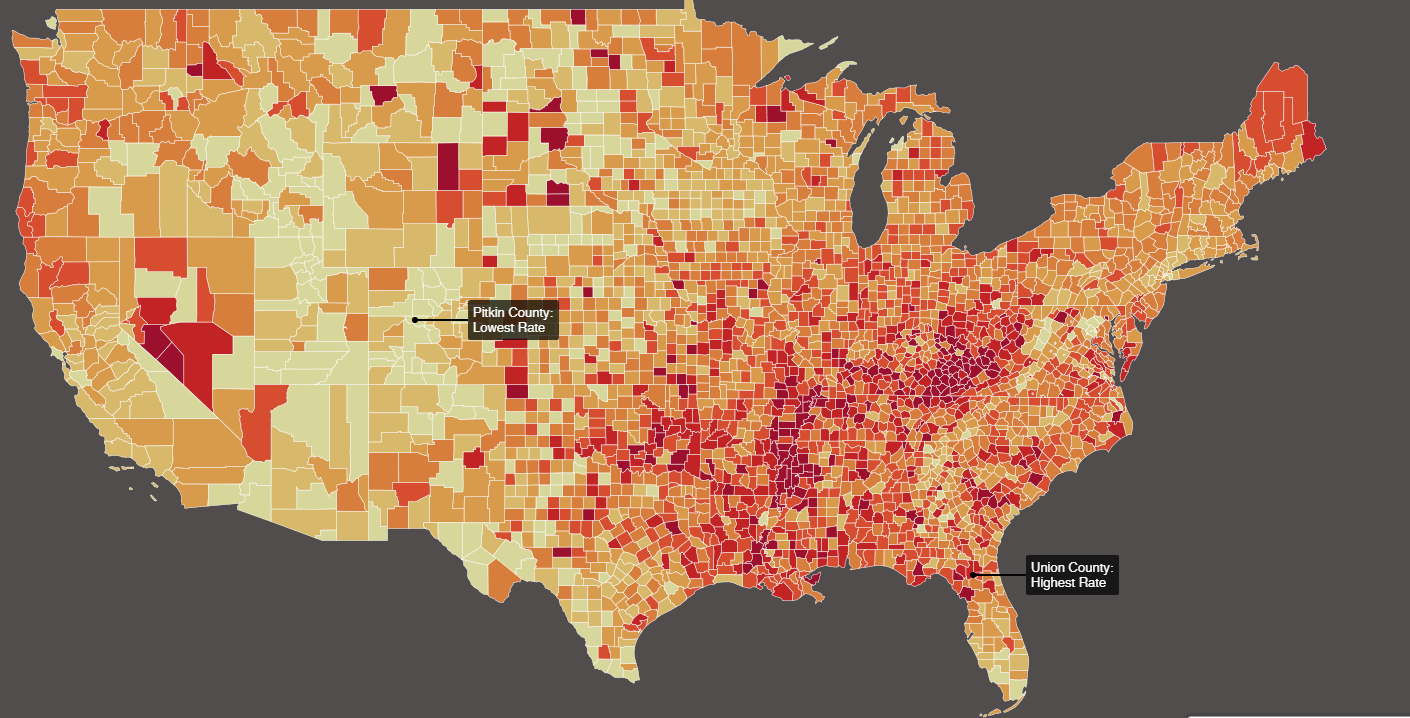
The map was built using QGIS processing and used CartoDB CartoCSS styles to Map Cancer Mortality rates by County in the US

The map was built using CartoDB processing and CartoCSS styles to Map Cancer Mortality rates by County in the US